Managed futures performance in May 2026 told two stories at once. The headline indices closed slightly negative on the month, but year-to-date numbers stayed firmly positive. Here is a look at the broad managed futures category through the most widely cited non-investable indices, and what the underlying market backdrop says about why.
May managed futures performance, in one table
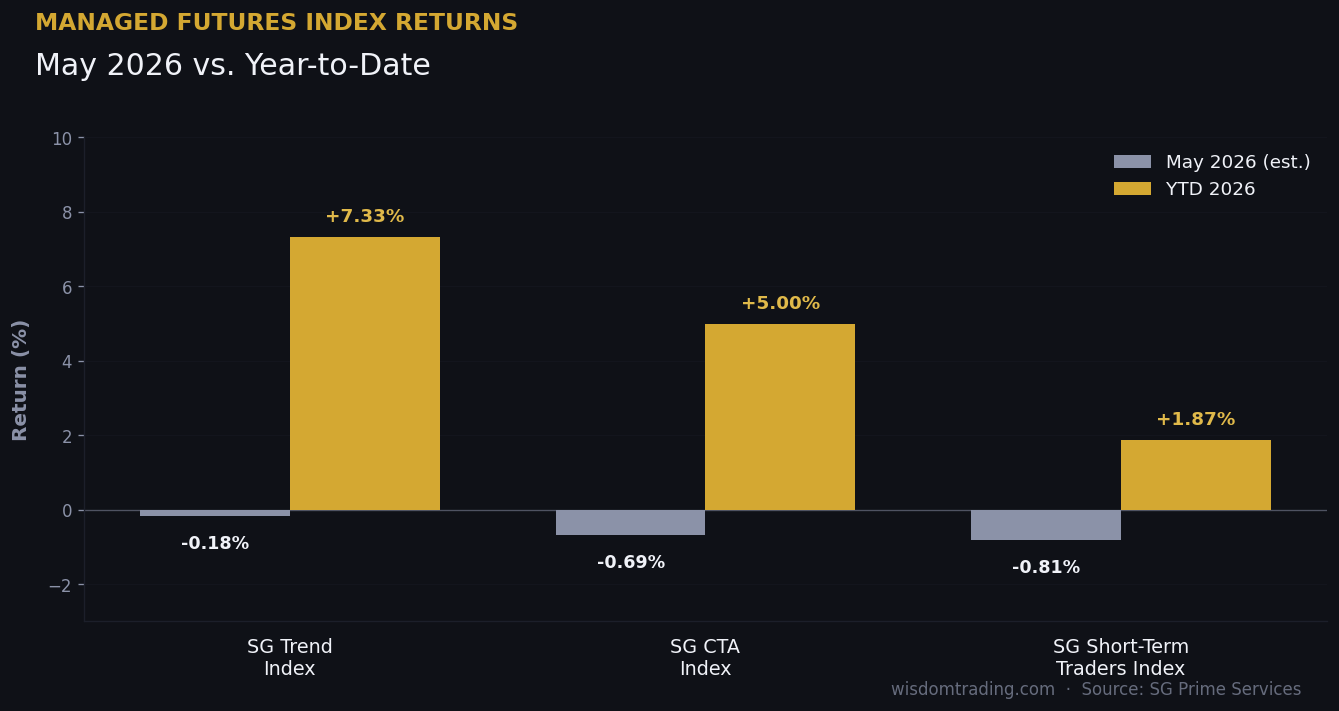
Preliminary estimates come from the Société Générale Prime Services daily index series, as published on their portal at the start of June. Numbers are net of fees at the constituent-manager level. They are subject to revision as month-end NAVs finalize.
| Index | May 2026 (est.) | YTD 2026 |
|---|---|---|
| SG Trend Index | -0.18% | +7.33% |
| SG CTA Index | -0.69% | +5.00% |
| SG Short-Term Traders Index | -0.81% | +1.87% |
Trend holds, short-term lags
Trend following held up best in a month that on the surface looked unfriendly to systematic positioning. A negative-but-small monthly print on a year-to-date base above +7% is the signature of a regime where some trends paid even as others reversed hard.
The broader SG CTA Index landed in the middle, as it usually does. It blends trend with other systematic styles. The 230 basis point year-to-date spread between SG Trend and SG CTA tells you trend has done a disproportionate share of the lifting in 2026 so far.
Short-term systematic traders had the toughest month of the three categories. That is what happens when directional moves both ways within the same month chop up shorter-holding-period strategies more than longer-horizon ones.
What was driving managed futures performance in May
Three macro themes dominated the trading environment in May. The interplay between them explains the index spreads above.
Crude oil had a violent two-way month
Energy started May elevated on the U.S.–Iran conflict and the threat of disruption through the Strait of Hormuz. WTI traded close to $100 in mid-May. Then optimism around an Iran deal and a stepped-down geopolitical risk premium hit. The contract sold off sharply in the back half of the month. WTI ended May near $87.36 on the front month.
That was a roughly 17% monthly decline. WTI’s worst since April 2025. Brent fell more than 19%, its worst month since the COVID shock in March 2020, per CNBC’s late-May coverage. For trend programs that had built long energy exposure on the early-month rally, that reversal cost. For short-term and counter-trend programs trying to fade the rally, the late-month break helped — but only if positioning was on the right side of an unusually fast move. WTI has since rebounded into the low $90s as the start of June reset the picture.
The dollar firmed
The DXY moved from roughly 99.8 at the start of May to about 101.7 at month-end. That was a 1.9% gain, with an intra-month high near 103.3. The drivers were straightforward.
The energy shock pushed U.S. headline inflation back to 3.8%, eliminating the Fed’s near-term cut path. The unresolved geopolitical backdrop kept a safe-haven bid under the dollar. Long-dollar, long-front-end-rates positioning was a steadier contributor across the systematic complex than energy was.
Gold consolidated below the January high
After printing an all-time high near $5,589 on January 28, gold spent the spring digesting the move. May was inside that consolidation. The front-month traded between roughly $4,450 and $4,770, with no clean directional commit either way.
That is a notable shift for the trend community, which had ridden gold up through most of 2025 and into early 2026. Positioning that paid most of the YTD return has now moved into a range-bound regime where new longs and new shorts are both harder to hold. Year-on-year, gold is still up about 41%.
The combined picture
Add to that a generally weaker bond complex — the inflation print made sure of that — and a tape in which large geopolitical and policy headlines moved prices in both directions inside the same week. The index spread we saw makes sense. Longer-horizon trend programs with exposure across rates, FX, and metals held. Programs concentrated in oil-driven exposure paid for the reversal. Short-term programs got whipsawed.
What managed futures performance suggests for allocators
Three takeaways worth noting if you are sitting on a managed futures sleeve or considering one.
The diversification case remains intact
In a month where U.S. equities and Treasuries were both noisy and the commodity complex finished sharply mixed, a small negative print from the systematic trend complex on a +7% YTD base is a reasonable outcome. That is the role managed futures is supposed to play in a portfolio. Non-correlated return that does not depend on equities being up.
Style dispersion inside the category is large
A 5.5 percentage point year-to-date spread between SG Trend and SG Short-Term Traders is not a small number. It is the difference between a strategy that is currently a meaningful diversifier and one that is barely above its hurdle. Allocators who treat the category as homogenous are pricing it wrong.
Benchmark each program against the right index
Mid-year is a useful checkpoint. Pure trend programs should be benchmarked against SG Trend. Diversified systematic CTAs should be benchmarked against SG CTA. Short-term systematic and global macro discretionary mixes belong against SG Short-Term Traders, or against the SG Macro Trading Index that reports separately mid-month and breaks out quantitative versus discretionary global macro. Mixing benchmarks across categories will mislead the comparison either way.
What to watch in June for managed futures performance
A few things will likely shape next month’s read.
Energy direction is the dominant variable
WTI is back in the low $90s at the start of June. Whether the rebound holds or reverses again will determine a lot about the systematic complex’s June print. Trend programs that took losses on the late-May reversal will be cautious about rebuilding length too quickly. That is typically when a fast move catches positioning offside in either direction. The IEA’s monthly Oil Market Report remains the best public read on the supply-demand balance heading into the next print.
The dollar’s path matters more than usual
The Fed’s optionality narrowed in May. If the next inflation print confirms the energy-driven uptick is broadening, dollar strength compounds. Short-DXY trades unwind further. If the print fades, the rate-cut narrative gets back on the table. The whole positioning structure rotates.
Gold’s range will tell you a lot
Gold’s behavior at trendline support will tell you whether 2026’s strongest YTD contributor for the trend community is consolidating or rolling. A break above the May highs near $4,770 reopens the long trade. A break below the May lows around $4,450 would be a meaningful technical and positioning event.
Mid-June macro indices
Finally, monthly indices like SG Macro Trading and SG Macro (Discretionary) report mid-June. Those numbers will offer a cleaner read on the discretionary-versus-systematic question. The daily indices alone do not isolate it as well.
A note on the data: All index figures here are from publicly available Société Générale Prime Services portal data and represent estimates as of early June 2026, subject to revision as constituent NAVs finalize. SG Prime Services indices are non-investable and provided for informational purposes; they are not benchmarks under Regulation (EU) 2016/1011. Past performance of any index is not indicative of future results, and the performance of any individual managed-futures program will differ — often materially — from the indices discussed here.
Wisdom Trading is an NFA-registered Independent Introducing Broker since 2003, providing access to managed futures programs cleared through R.J. O’Brien, StoneX, and Phillip Capital. If you’d like to discuss managed futures in the context of your portfolio, start a conversation or explore our managed futures services.